4 Self-learning steps to get started in Data Analytics
Aquick intro on my background, I do not study data science or computer science. Hence, I understand how hard it is for some people who want to start in this field (to become a data analyst, BI analyst, data engineer, data scientist, etc) but wonder how.

Source: Internet
I would share my simple formula (my journey had a lot more failures, doubts, lost feelings, and certainly took more time) for how should you start. And most importantly, finding a job that you love. By the way, I love my job 😊
Before jumping on the topic, these steps could take months, or years (depending on your commitment level). Thus, ensure you have the strong motivation of starting something and pursuing it.
Let’s cut the chase and get into my 4 favorite self-learning steps
1. Learning Data Analytics Fundamentals
Many people ask me the first question when they want to switch their career to data analytics “what tool/certificates I should start learning?”. The answer would always be: You should start with fundamentals.
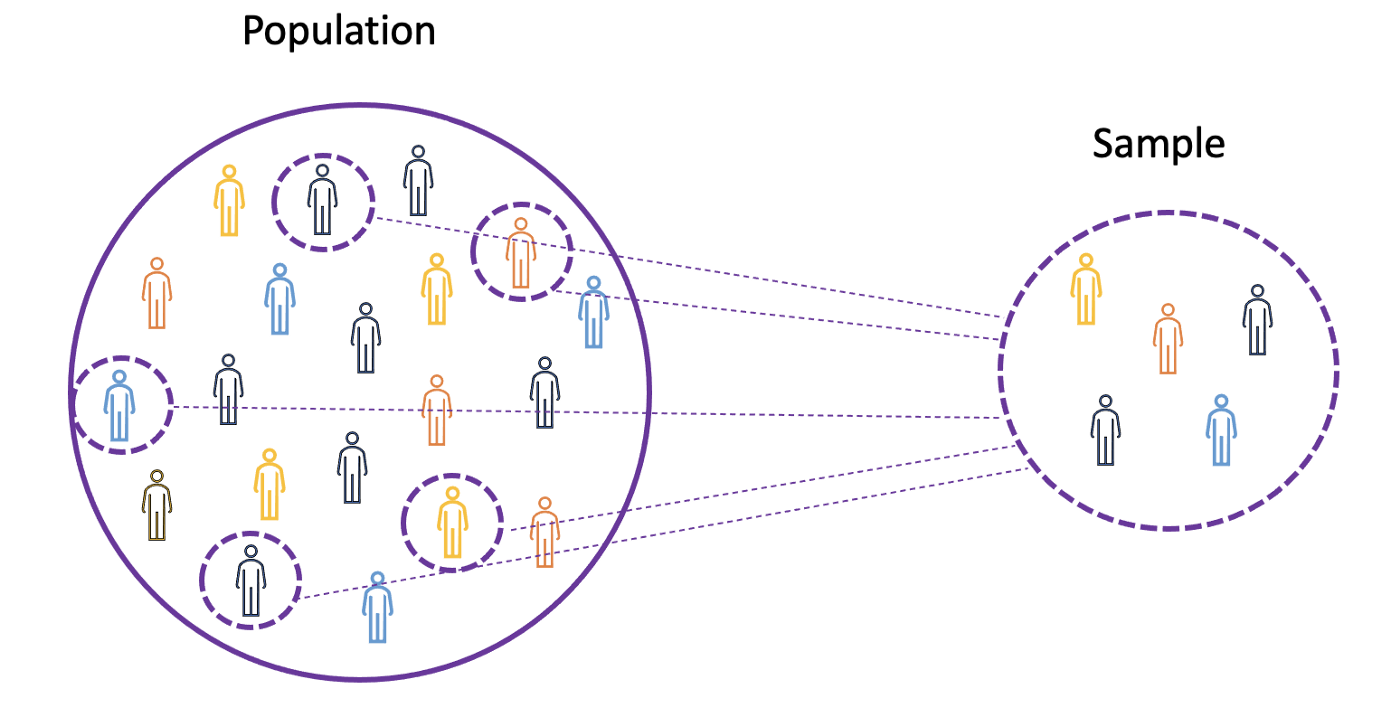
Source: Read more on Fundamentals Of Statistics For Data Scientists and Analysts
What are Data Analytics Fundamentals? Basic Statistic. This would enable you the ability to ask the right question and find the right methodology to answer this. In most case, an analyst always need to break down to smaller questions that are easier to answer
For example: How should we increase the price of the item without losing our growth? (Stop new customers coming and let our existing customers leave us and never come back). To answer this complex problem, instead of bumping into the toolkit and how to code, a simple approach can be:
- What drives the price? Cost, revenue. Do we have data on it?
- What drives the cost? What drives the revenue? Do we have data on it?
- What is the optimal point of price that maximise the revenue and minimise the churn? What methodology should we use to predict the impact of price?
After breaking down into the smaller questions. How do we explore the data we have?
This is when most statistic courses would enable you to:
Define and recognize key descriptive statistics
Describe and distinguish between the central limit theorem and the law of large numbers
Identify strategies for constructing an unbiased sample
Where to learn statistics? if you do not learn any of this before in university or school, you can refer to some online free course
2. Start with the right Toolbox
This is the step when you should slow down and make some research on the difference in roles in data analytics. I particularly love this Infographic; this explains a lot about data roles and what tools I should learn. The role in each company is not always the same scope or responsibility. So, keep in mind this is a reference only.
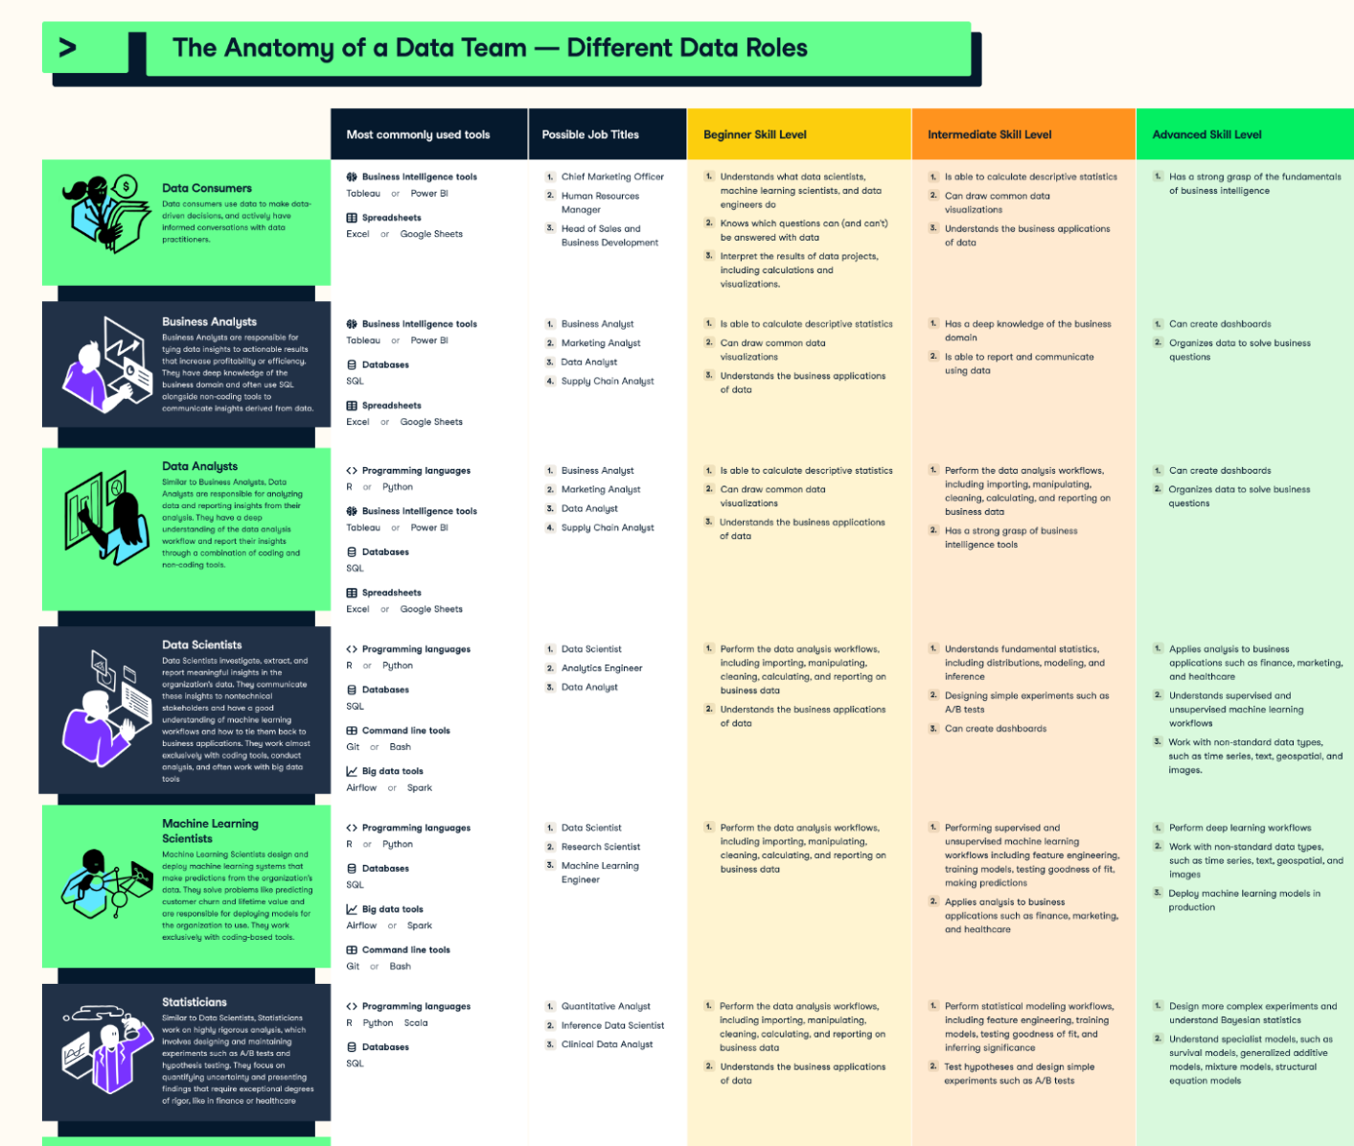
Source: Datacamp — Read more on The Anatomy of a Data Team
Plus video (5mins) for your reference: Data Science in 5 mins
Each role would require a deeper understanding and experience of the different toolboxes. Indeed, finding the right tools after collecting data has always resonated intrinsically with my experience working in data analytics.
If you do not know what role you would follow in the future, then I would recommend starting with the top 3 below:
*BI Tools:
PowerBI and Looker are my top selection. BI tools bring huge support for delivering data insight to more people. As a data enthusiast, it is important to understand how to use this tool, and the best case to choose the visualization. This would boost your skills to explain the problem and present it to a wider group of stakeholders. There are tons of visualization tools out there (some for your reference) that you can start and practice with such as Tableau, SAS, etc. However, I particularly like PowerBI and Looker.
For PowerBI, you can easily access via Microsoft and many good practices linking with excel. I refer to BI courses to learn
For Looker, this is the tool that was acquired by Google in 2019 and become one of my favourites because of its friendly UXI and practical function. Free Looker course to kick start.
*SQL
Structured Query Language. Fundamentally, it’s used to get your question answered with data from a Relational Database (You can easily understand this term after step 1 fundamentals). This language would contribute tremendous value to answering the basic question that the visualization tool may not present or missing. Below are some top courses I did start with to learn SQL. In my opinion, it is good to give you a strong sense of the real practical case (My top selection from a ton of courses out there).
*Python:
You must hear this programming language somewhere as its popularity in real practice. Python is particularly well suited for deploying machine learning at a large scale and very friendly application for any data exploration. This language is basically given you a deeper understanding of your raw data and how to manipulate it, answering the tougher questions and furthermore, automation. My top references:
3. Practice and Practice! Sharpen your skills
Where to practice?
Certainly, there are many websites for you to practice, but I personally love 2 communities where you not only can practice and build your portfolio but most importantly, learn from others.
Kaggle is the world’s largest community of data scientists and machine learning enthusiasts. This platform is the fastest way to get started on a new data science project. It also provides a very friendly interface to practice Jupyter notebook with a single click and is easy to build with the backup of the huge repository (free code and data).
Most importantly, I learned a lot from other’s works. I believe learning from people in the same community is the fastest ways to sharpen your skills.
I mainly use Github to read and learn experiences from others. Different than Kaggle, Github is more focused on function. Github is one of the biggest host sites for GIT (versioning control system). Basically, it allows you and others to manage the changes in the code at the same time without conflict. I am sure you will use it at least once in a real job. Highly recommend it if you want to start your portfolio.
4. Build your own portfolio
I would highly recommend that you should start building your portfolio as soon as you plan to practice. I write another article about HOW TO BUILD A DATA PORTFOLIO and it explains the steps below further in detail. It contains a simple workflow that I apply to most of my task job.
Step 1: Collecting Data
Step 2: EDA (Exploratory Data Analysis) and Cleaning Data
Step 3: Project techniques
Step 4: Insights and recommendations
“Focus on the storytelling and data insights, rather than the methods”
Source: Internet
Some examples of good analysis for your inspiration
What’s Next?
Learning every day!!! I build for myself the habit of reading the news daily and listening to podcasts before going to sleep. It is not easy to build but once you do, it brings you tremendous value.
Source: Internet
Where to read?
Check out my latest article Top 5 Fintech sources.
No method is right or wrong to start learning something. The tips are from my experience. We all have a very different approach. Find the one that suits you. I hope these tips would be helpful somehow as references.
